
 Twice per year, The New American publishes The Freedom Index. This is a scorecard of U.S. Senators and Congressmen where key issues such as federal disaster assistance, CISPA, and ObamaCare repeal are used to determine how closely each congressman voted in adherence to the principles of the U.S. Constitution. Below is a summery of how the representatives from the north Texas area scored. (each name is also a link to a new page with specific information on each member and how they voted on each issue used in the score — The first number shown is the overall score and the second is the most recent score)
Sen. Ted Cruz – 90% / 90%
Sen. John Cornyn – 68% / 89%
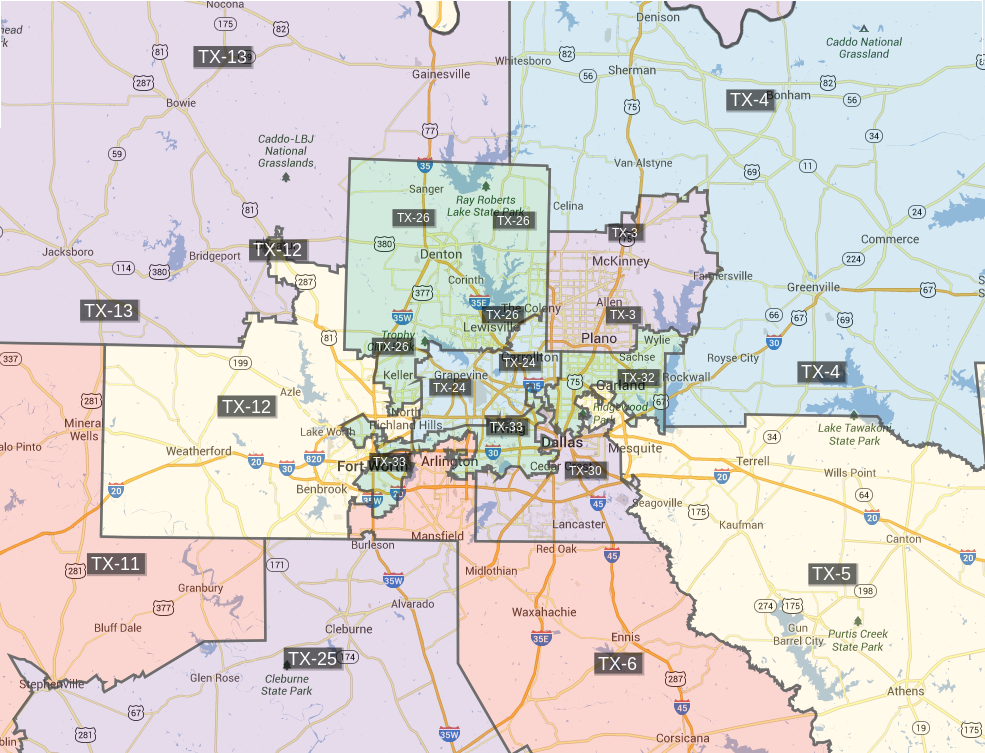
Dist.3: Sam Johnson – 66% / 67%
Dist.4: Ralph Hall – 59% / 90%
Dist.5: Jeb Hensarling – 67% / 70%
Dist.6: Joe Barton – 61% / 79%
Dist.11: K. Conaway – 63% / 70%
Dist.12: Kay Granger – 52% / 70%
Dist.13: Mac Thornberry – 55% / 70%
Dist.24: Kenny Marchant – 68% / 80%
Dist.25: Roger Williams – 80% / 80%
Dist.26: Michael Burgess – 66% / 70%
Dist.30: Eddie Johnson – 18% / 10%
Dist.32: Pete Sessions – 61% / 67%
Dist.33: Marc Veasey – 10% / 10%